About Content Marketing Metrics & Analytics: 5 Types Of Data Insights
Content marketing has become a crucial part of every business’s marketing strategy. It helps businesses attract, engage, and convert their target audience by providing them with valuable, informative, and relevant content. However, creating and publishing content alone is not enough to achieve success in content marketing. It is equally essential to measure the effectiveness of your content marketing efforts through metrics and analytics. By tracking the right metrics and analyzing the data, businesses can gain valuable insights into their content marketing performance, identify areas for improvement, and optimize their content marketing strategy accordingly. In this article, we will discuss the essential content marketing metrics and analytics that every business should track.
1. Traffic Metrics: Traffic metrics measure the number of visitors to your website or landing page, the source of traffic, and the behavior of visitors. The most common traffic metrics include pageviews, unique visitors, bounce rate, and time on page. By tracking traffic metrics, businesses can determine the effectiveness of their content in driving traffic to their website and identify areas for improvement. For example, if the bounce rate is high, it could indicate that the content is not relevant or engaging enough.
2. Engagement Metrics: Engagement metrics measure how visitors interact with your content. The most common engagement metrics include social shares, comments, likes, and click-through rates. By tracking engagement metrics, businesses can determine how well their content resonates with their target audience and whether it is meeting their expectations. For example, if the social shares are low, it could indicate that the content is not share-worthy.
3. Conversion Metrics: Conversion metrics measure the number of visitors who take the desired action, such as filling out a form, subscribing to a newsletter, or making a purchase. The most common conversion metrics include conversion rate, cost per acquisition, and customer lifetime value. By tracking conversion metrics, businesses can determine the effectiveness of their content in driving conversions and identify areas for improvement. For example, if the conversion rate is low, it could indicate that the content is not persuasive enough.
4. SEO Metrics: SEO metrics measure the effectiveness of your content in improving your website’s search engine rankings. The most common SEO metrics include organic search traffic, keyword rankings, and backlinks. By tracking SEO metrics, businesses can determine the effectiveness of their content in attracting organic search traffic and improving their search engine rankings. For example, if the organic search traffic is low, it could indicate that the content is not optimized for search engines.
5. Audience Metrics: Audience metrics provide insights into your target audience’s demographics, interests, and behavior. The most common audience metrics include age, gender, location, interests, and devices used. By tracking audience metrics, businesses can determine whether their content is reaching the right audience and tailor their content marketing strategy accordingly. For example, if the majority of the audience is male, it could indicate that the content is not resonating with female audiences.
Content marketing metrics and analytics play a vital role in measuring the effectiveness of your content marketing strategy. By tracking the right metrics and analyzing the data, businesses can gain valuable insights into their content marketing performance, identify areas for improvement, and optimize their content marketing strategy accordingly. Therefore, it is essential to define your content marketing goals, track the relevant metrics, and use the data to make data-driven decisions to improve your content marketing efforts.
What is Data Insights?
Data insights are the valuable and actionable information extracted from data through analysis and interpretation. These insights enable organizations to make informed decisions and take actions that lead to better outcomes. Data insights are essential for organizations that want to remain competitive in today’s data-driven business environment. With the increasing volume and complexity of data available to organizations, data insights have become more critical than ever.
The process of extracting data insights begins with collecting data from various sources. This data can come from internal systems, such as customer relationship management (CRM) and enterprise resource planning (ERP) systems, or external sources, such as social media and market research reports. Once the data is collected, it is cleaned, transformed, and organized to make it suitable for analysis.
The next step is to analyze the data to extract insights. There are various analytical techniques that can be used to analyze data, such as statistical analysis, machine learning, and data visualization. Statistical analysis involves using mathematical models and algorithms to identify patterns, correlations, and trends in the data. Machine learning involves using algorithms that learn from data to make predictions and decisions. Data visualization involves presenting data in a graphical format, such as charts and graphs, to help users understand the patterns and trends in the data.
Once insights are extracted from the data, they can be used to inform decision-making and take action. For example, insights from customer data can be used to improve customer experiences, insights from supply chain data can be used to optimize operations, and insights from financial data can be used to improve profitability.
Data insights are not only valuable for organizations but also for individuals. For example, wearable devices such as fitness trackers and smartwatches can collect data on an individual’s physical activity, heart rate, and sleep patterns. This data can be analyzed to provide insights on the individual’s health and well-being, and to identify areas where they can make improvements.
There are several challenges associated with extracting insights from data. One of the biggest challenges is the quality of the data. Data can be incomplete, inconsistent, or inaccurate, which can lead to incorrect insights. Another challenge is the complexity of the data. With the increasing volume and variety of data, it can be challenging to identify patterns and trends. Additionally, data privacy and security concerns must be addressed to ensure that sensitive data is protected.
Data insights are the valuable and actionable information extracted from data through analysis and interpretation. They enable organizations to make informed decisions and take actions that lead to better outcomes. With the increasing volume and complexity of data available to organizations, data insights have become more critical than ever. However, there are several challenges associated with extracting insights from data, such as data quality, complexity, and privacy and security concerns. Despite these challenges, the benefits of data insights make it worthwhile for organisations to invest in data analytics capabilities.
Types of Data Insights
Data insights are the outcomes of data analysis that help companies to make informed decisions. Data insights can be divided into different types based on the objectives of the analysis. Here are five types of data insights that organisations can obtain from their data.
1. Descriptive Insights: Descriptive insights are the most basic type of data insights that provide information about what happened in the past. They are used to summarize historical data and provide an overview of what has occurred. Descriptive insights are helpful for businesses to understand what has happened in the past, identify trends, and recognize patterns in their data. For example, a retailer may use descriptive insights to understand the sales trend of a particular product over a given period of time.
2. Diagnostic Insights: Diagnostic insights are used to understand why something has happened in the past. They are used to identify the root cause of a particular problem or opportunity. Diagnostic insights are crucial for businesses to identify the underlying reasons behind trends and patterns in their data. For example, a healthcare provider may use diagnostic insights to identify the root cause of a sudden increase in patient admissions to a particular department.
3. Predictive Insights: Predictive insights are used to predict what may happen in the future based on historical data. They are used to forecast future trends and patterns in the data. Predictive insights are essential for businesses to plan for the future and make informed decisions based on what is likely to happen. For example, a manufacturer may use predictive insights to forecast the demand for a particular product in the upcoming quarter.
4. Prescriptive Insights: Prescriptive insights are used to recommend the best course of action to achieve a specific goal. They are used to guide decision-making and suggest a solution to a problem or opportunity. Prescriptive insights are valuable for businesses to optimize their operations and improve their performance. For example, a logistics provider may use prescriptive insights to suggest the best route for a delivery to minimise time and cost.
5. Cognitive Insights: Cognitive insights are a type of data insight that leverages artificial intelligence and machine learning to gain insights from unstructured data sources such as text, audio, and images. They are used to extract meaningful information from large volumes of unstructured data that would be challenging to analyze manually. Cognitive insights are valuable for businesses to gain a more comprehensive understanding of their customers, competitors, and industry trends. For example, a marketing team may use cognitive insights to analyze customer feedback and sentiment from social media posts to improve their products and services.
Data insights are valuable for businesses to gain a comprehensive understanding of their operations, customers, and industry trends. By leveraging the different types of data insights, organisations can make informed decisions and optimize their operations to improve their performance. Whether it’s descriptive, diagnostic, predictive, prescriptive, or cognitive insights, each type of insight provides a different perspective on the data and can be used to achieve different business objectives.
Conclusion
In conclusion, content marketing metrics and analytics are crucial for measuring the effectiveness of a content marketing strategy. By tracking and analyzing data, content marketers can gain valuable insights into audience behavior, content performance, and campaign success.
By analysing these types of data, content marketers can identify areas for improvement, optimize their strategies, and ultimately achieve their content marketing goals. It’s important to regularly review and adjust metrics to ensure that the content marketing strategy is on track and delivering the desired results.
Frequently Asked Questions:
Content marketing metrics are important because they provide valuable insights into the performance of a campaign. By measuring the success of the campaign, marketers can identify what works and what doesn’t, and use that information to optimize their future marketing efforts.
There are various types of content marketing metrics, including engagement metrics (such as likes, shares, comments), traffic metrics (such as pageviews, unique visitors), conversion metrics (such as lead generation, sales), and retention metrics (such as repeat visitors, customer lifetime value).
Metrics are the numerical measurements used to assess the performance of a campaign, while analytics involves the process of analyzing the data to gain insights and make decisions based on the results.
Vanity metrics are metrics that provide surface-level insights into the performance of a campaign, such as the number of social media followers or website visits. Actionable metrics, on the other hand, are metrics that provide actionable insights that can be used to improve the campaign’s performance.
Measuring the ROI of a content marketing campaign involves comparing the cost of the campaign to the revenue generated as a result of the campaign. This can be done by tracking conversion metrics, such as lead generation and sales.
A/B testing involves testing two different versions of a piece of content to see which one performs better. It is used in content marketing to optimize content by identifying which elements (such as headlines or images) are most effective at engaging the target audience.
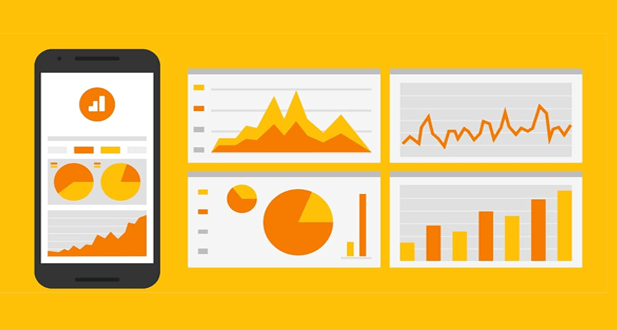
Data visualization is used to present data in a visual format, making it easier to understand and interpret. It can be used in content marketing metrics to create charts, graphs, and other visual aids that help to identify trends and patterns in the data.
Content marketing metrics can be used to identify what content is most effective at engaging the target audience, which channels are most effective at driving traffic and conversions, and what topics and formats are most popular. This information can be used to inform the content strategy and optimize future marketing efforts.
There are various tools available to measure content marketing metrics, including Google Analytics, HubSpot, Hootsuite, and Moz. These tools can provide insights into engagement, traffic, conversion, and retention metrics, allowing marketers to track and optimise the performance of their campaigns.


