Check your Win Loss ratio
A win/loss ratio measures how often trades result in wins versus losses. Therefore, instead of considering how much was won or lost, it only concentrates on counting the number of winners and losers. The number of winners or losers is more heavily influenced by the win/loss ratio than the size of the prize earned or lost. It is mostly used in business to identify closed and unclosed deals; it does not take into account deals that are still pending or in the pipeline. Most day traders utilize the win/loss ratio to evaluate their daily gains and losses from trading. In order to calculate the likelihood of a trader’s success, it is combined with the win rate or the proportion of deals that are profitable. It is typically advantageous to have a win/loss ratio or win rate higher than 1.0 or 50%.
How to check or calculate the win-loss ratio
The win-loss ratio is a common metric used in various fields such as sports, gaming, finance, and business to measure performance. It indicates the ratio of wins to losses, providing insights into the success rate and overall effectiveness of strategies or individuals. This comprehensive guide will delve into the concept of the win-loss ratio, its importance, and detailed steps to calculate and analyze it effectively.
Understanding the Win-Loss Ratio

What is the Win-Loss Ratio?
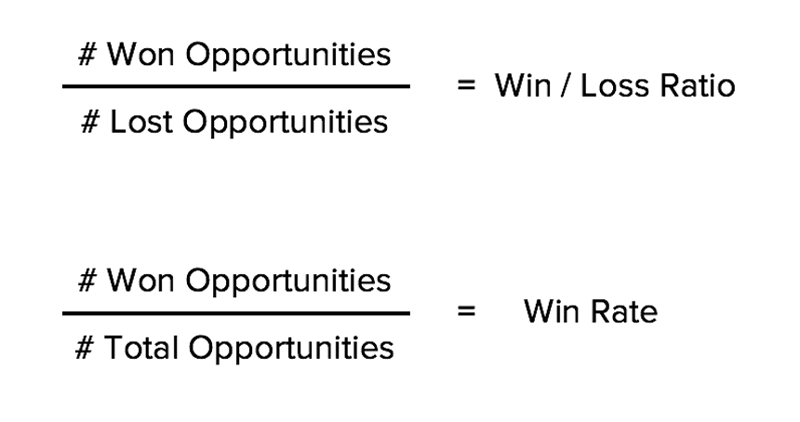
The win-loss ratio is a simple mathematical expression that compares the number of wins to the number of losses. It is calculated by dividing the number of wins by the number of losses. The resulting figure represents how many wins occur for every loss.
Importance of the Win-Loss Ratio
- Performance Measurement: Provides a clear and straightforward metric for assessing performance.
- Benchmarking: Allows comparison against peers or historical performance.
- Strategic Insights: Helps in identifying strengths, weaknesses, and areas for improvement.
- Motivation: Can serve as a motivational tool to strive for better results.
Calculating the Win-Loss Ratio
Basic Calculation
The basic formula for calculating the win-loss ratio is:
Win-Loss Ratio=Number of WinsNumber of Losses\text{Win-Loss Ratio} = \frac{\text{Number of Wins}}{\text{Number of Losses}}
For example, if a team has 20 wins and 5 losses, the win-loss ratio is:
Win-Loss Ratio=205=4\text{Win-Loss Ratio} = \frac{20}{5} = 4
This means the team wins 4 times for every loss.
Extended Calculation: Including Draws
In some cases, there might be draws or ties in addition to wins and losses. To accommodate draws, a modified version of the formula can be used, often referred to as the win-draw-loss ratio:
Win-Draw-Loss Ratio=Number of WinsNumber of Draws+Number of Losses\text{Win-Draw-Loss Ratio} = \frac{\text{Number of Wins}}{\text{Number of Draws} + \text{Number of Losses}}
For instance, if a team has 15 wins, 3 draws, and 7 losses, the ratio would be:
Win-Draw-Loss Ratio=153+7=1.5\text{Win-Draw-Loss Ratio} = \frac{15}{3 + 7} = 1.5
This indicates 1.5 wins for every draw or loss combined.
Win Percentage
Another related metric is the win percentage, which shows the proportion of games won out of the total games played. It is calculated as:
Win Percentage=(Number of WinsTotal Games Played)×100\text{Win Percentage} = \left( \frac{\text{Number of Wins}}{\text{Total Games Played}} \right) \times 100
Using the previous example with 15 wins, 3 draws, and 7 losses, the win percentage would be:
Total Games Played=15+3+7=25\text{Total Games Played} = 15 + 3 + 7 = 25
Win Percentage=(1525)×100=60%\text{Win Percentage} = \left( \frac{15}{25} \right) \times 100 = 60\%
Practical Applications
Sports
In sports, the win-loss ratio is a critical statistic for teams and individual players. It helps coaches and analysts evaluate performance, develop strategies, and make decisions about player selections and game plans.
Example: In a basketball season, if a team wins 30 games and loses 10, the win-loss ratio is:
3010=3\frac{30}{10} = 3
This means the team wins three times for every loss.
Gaming
In gaming, especially in competitive and online multiplayer games, players and teams track their win-loss ratios to gauge their skills and improve their gameplay.
Example: If a gamer has 200 wins and 50 losses in a game, the win-loss ratio is:
20050=4\frac{200}{50} = 4
Indicating four wins for every loss.
Finance and Trading
In finance, particularly in trading, the win-loss ratio is used to assess the performance of trading strategies. It helps traders understand how often their trades are profitable versus unprofitable.
Example: If a trader makes 40 profitable trades and 10 unprofitable trades, the win-loss ratio is:
4010=4\frac{40}{10} = 4
Meaning the trader has four profitable trades for every unprofitable trade.
Business
Businesses use the win-loss ratio to evaluate sales performance, particularly in competitive bids and proposals. It helps sales teams understand their success rate in converting leads into customers.
Example: If a sales team wins 25 contracts and loses 5, the win-loss ratio is:
255=5\frac{25}{5} = 5
Indicating five wins for every loss.
Advanced Analysis and Interpretation
Contextual Factors
While the win-loss ratio is a valuable metric, it should be analyzed in context. Factors such as the level of competition, changes in strategy, and external conditions can influence the ratio. Understanding these factors provides a more comprehensive assessment.
Trends Over Time
Analyzing the win-loss ratio over time can reveal trends and patterns. A consistently improving ratio indicates positive progress, while a declining ratio may signal issues that need addressing.
Benchmarking
Comparing the win-loss ratio against industry benchmarks or competitors helps identify relative performance. It highlights areas where an individual or team is excelling or lagging behind.
Complementary Metrics
The win-loss ratio should be used alongside other metrics for a holistic evaluation. In sports, this could include player statistics and team dynamics. In finance, metrics like risk-adjusted return and drawdown provide additional insights.
Setting Goals
Use the win-loss ratio to set realistic and achievable goals. For instance, a sports team might aim to improve its ratio by focusing on specific areas of performance, such as defense or offense.
Tools and Resources
Spreadsheets
Use spreadsheet software like Microsoft Excel or Google Sheets to calculate and track win-loss ratios. Spreadsheets allow for easy data entry, calculations, and visualization through charts and graphs.
Statistical Software
For more advanced analysis, statistical software like R, Python, or SAS can be used. These tools offer robust capabilities for data manipulation, statistical analysis, and visualization.
Online Calculators
Various online calculators are available to quickly compute win-loss ratios. These tools are useful for quick calculations without the need for manual computation.
Mobile Apps
Several mobile apps are designed to track and analyze performance metrics, including win-loss ratios. These apps are convenient for real-time tracking and analysis.
Step-by-Step Guide to Calculate Win-Loss Ratio
Step 1: Gather Data
Collect the data on wins and losses. Ensure the data is accurate and up-to-date. For more detailed analysis, include additional variables such as dates, locations, and conditions.
Step 2: Organize Data
Organize the data in a structured format. Use a table or spreadsheet to list the number of wins and losses along with any other relevant information.
Step 3: Calculate the Ratio
Apply the win-loss ratio formula:
Win-Loss Ratio=Number of WinsNumber of Losses\text{Win-Loss Ratio} = \frac{\text{Number of Wins}}{\text{Number of Losses}}
Enter the values for wins and losses and perform the division to obtain the ratio.
Step 4: Analyze Results
Interpret the results in context. Consider factors that may have influenced the ratio and compare it against benchmarks or historical data.
Step 5: Visualize Data
Create visualizations such as charts or graphs to represent the win-loss ratio. Visual aids make it easier to understand trends and patterns.
Step 6: Report Findings
Compile the results and insights into a report. Include recommendations for improving the win-loss ratio and set goals for future performance.
Case Studies
Case Study 1: Sports Team
A basketball team wants to evaluate its performance over the season. They track their wins and losses and calculate the win-loss ratio.
Data:
- Wins: 28
- Losses: 12
Calculation: Win-Loss Ratio=2812=2.33\text{Win-Loss Ratio} = \frac{28}{12} = 2.33
The team wins approximately 2.33 times for every loss. They analyze the data further to identify strengths and areas for improvement.
Case Study 2: Sales Performance
A sales team tracks their success in closing deals. They calculate the win-loss ratio to assess their effectiveness.
Data:
- Wins: 15
- Losses: 5
Calculation: Win-Loss Ratio=155=3\text{Win-Loss Ratio} = \frac{15}{5} = 3
The team has a win-loss ratio of 3, indicating three successful deals for every lost opportunity. They use this information to refine their sales strategies.
Case Study 3: Trading Strategy
A trader tracks the performance of their trading strategy. They calculate the win-loss ratio to understand the strategy’s success rate.
Data:
- Profitable Trades: 40
- Unprofitable Trades: 20
Calculation: Win-Loss Ratio=4020=2\text{Win-Loss Ratio} = \frac{40}{20} = 2
The trader has a win-loss ratio of 2, indicating two profitable trades for every unprofitable trade. They use this metric to adjust their trading approach.
- Gather the data: The initial step is to gather the information from which you will ultimately derive conclusions and take action. You should at the very least be aware of each opportunity’s name, owner, and whether it was successful or unsuccessful. There’s a good chance you’ll need more. Your goals for the win/loss ratio should guide the types and sources of data you use.
- Sales Data – Given their attention, your sales representatives are undoubtedly making notes on each opportunity in your customer relationship management (CRM) system. If you browse through these notes, you’ll discover a wealth of important information about job titles, levels of seniority, pain points, use cases, objections, rivals, and more.
- Prospect and Customer Feedback – Picking the brains of those who ultimately decide whether you win or lose agreements is the best approach to acquiring win/loss data. Interviews with potential clients and consumers are extremely beneficial since they give you direct access to decision-makers thoughts (or the minds of those who work closely with decision-makers). Even better than letters from sales representatives is going right to the source.
- Firmographic data – Comparable to how demographics apply to persons, firmographics are a set of traits used to categorize firms. Although that won’t always be the case, some sales representatives may provide firmographic information in their opportunity notes. A necessity if you’re interested in measuring performance in connection to industry, geography, revenue, company size, company maturity, or any other variable along those lines is firmographic data, which is typically collected via the form and saved within your CRM solution.
- Marketing Data – It might be helpful to look for patterns in how prospects interact with your marketing materials to understand why sales are won or lost. You can segment opportunities by age, traffic source, lead source, content engagement, and other factors using your content management system (CMS), CRM solution, and other marketing automation tools you may need.
- Analyze Your Data: It’s time for analysis once you’ve obtained your data, such as after interviewing prospects and clients, compiling sales reps’ notes from opportunities involving competitor ABC, counting the number of opportunities involving businesses in industry ABC, etc. In other words, now is the moment to provide answers to the questions you posed to yourself before beginning step 1. Starting your win/loss analysis at a high level could be beneficial. Determine your total victory percentage, overall win/loss ratio, and perhaps your overall competitive win percentage (i.e., the rate at which you win deals that involve at least one competitor). You successfully contextualize everything you discover by starting with these high-level measures. Imagine that you start your study by determining a 25% overall competitive victory rate. You would be able to easily conclude that your sales reps perform exceptionally well against that particular competition if, later in your investigation, you were to calculate a win rate against Competitor ABC of 40%.
- Win Loss Ratio by Competitor – It might be challenging to decide whether competitors are more or less deserving of your attention if your company is like the majority of businesses in that you operate in an industry that is becoming more and more competitive. Calculating your rate of deal wins and the ratio of opportunities won to opportunities lost for each rival is one technique to come to this conclusion.
- Win Loss Ratio by Persona – A collection of problems addressed by your answer. However, it shouldn’t be assumed that all prospects would share those pain issues in the same way, and as a result, it shouldn’t be assumed that they will all react similarly to your sales and marketing strategies. You may determine how successfully (or poorly) your strategy is connecting with various audiences by analyzing win rate and win/loss ratio by persona.
- Win Loss Ratio by Lead Source – To get customers, you need to generate leads. Additionally, you shouldn’t expect that all lead sources will result in bottom-line results at the same rate, just as you shouldn’t assume that all prospects would suffer pain points in the same way. You may determine which leads are more likely to become customers and which are less likely by calculating the win rate and win/loss ratio by lead source.
- Take Action – You need to understand now why you close some offers and don’t close others, the main goal of this activity is to gradually improve performance. The third and last step in our win/loss ratio analysis process is action.
- Narrow your Focus – Your sales force may experience disproportionate difficulty with certain sorts of businesses. Consider reducing your focus if you’re looking for businesses that fit certain criteria, such as those that are a certain size, mature, come from a given industry, or something similar.
- Revisit your personas – Sometimes sales professionals have problems with certain prospects, or personas, rather than specific firms. If that’s the case, a number of variables might be in play. It’s likely that the personalities your reps have trouble with are just the wrong ones for your solution. For whatever reason, marketing leaders might not be the best people to discuss your product or service with if, for instance, your reps are targeting both sales leaders and marketing leaders and are having disproportionate difficulty with the latter group. An additional argument is that, despite the fact that marketing leaders are the best individuals to reach out to, your reps lack the knowledge necessary to make an effective pitch to them.
- Improve your competitive battle cards – Perhaps your sales representatives have trouble with certain competitors rather than specific businesses or personas. Again, there are several reasons why this can be the case. While one rival might do a great job of portraying their product as a superior alternative to yours, another might do a great job of rewarding customers with discounts. Whatever the situation, if you see that performance suffers when certain opponents are involved, optimizing your competitive battle cards is probably the best course of action. Your sales agents will be better able to close deals if you can provide them with contextualized real-time intelligence and ready-made conversational strategies.
- Tweak your Product roadmap – it is more likely to be supported by qualitative data, notably the feedback you get from potential customers who chose to purchase an alternative solution, rather than quantitative data. Your product roadmap might not be as well matched with market demands as it needs to be when you go through their responses. Consider the case when your business offers email marketing software. The lack of detail provided by your analytics tools is the most frequent cause of lost deals, which you observe as you evaluate your interviews with prospects. Well, it’s obvious there is a problem if your product roadmap does not include upgrades to your analytics tools.
To dominate the competition, use Win Loss Analysis
The 2021 State of Competitive Intelligence Report finds that 53% of sales deals are competitive and 84% of organizations feel their markets are becoming more congested. It’s more important than ever to comprehend both the reasons why you succeed and fail. What makes us say that? Because having that knowledge gives you the power to continually choose wisely. You can better direct your company’s course when you are aware of how well or poorly you perform in relation to particular metrics. When the data is on your side, you’re much less likely to make a mistake, whether that means doubling down on a specific industry, reconsidering the language you use when speaking with prospects, or investing in competitor intelligence.
Conclusion
Even while the win/loss ratio is primarily used to forecast success rates and assign probabilities for them, which is convenient for stockbrokers or traders, it occasionally may not be an efficient measure. It misses the fact that it does not take into account the monetary value of the chances gained or lost for each trading action. However, it can still be regarded as a crucial benchmark for market traders to assess the proportion of profitable trades to unsuccessful ones. Overall, it provides us with information on the likelihood that a trader will succeed in making money and experience failure.
To determine a trader’s likelihood of success, the win/loss ratio is categorically combined with the win rate ratio. As previously said, because we do not take into account the dollars involved in a deal, this is not necessarily the true picture. As a result, an efficient trader has a higher win-loss ratio in terms of the volume of business and transactional value.
Frequently Asked Questions
Generally speaking, it is beneficial to have a victory rate or win/loss ratio greater than 1.0 or 50%.
A Win/Loss statement is a document that estimates play (the sum of money earned and lost) for the year depending on when a Players Club card is correctly inserted into the gaming device while play is being conducted.
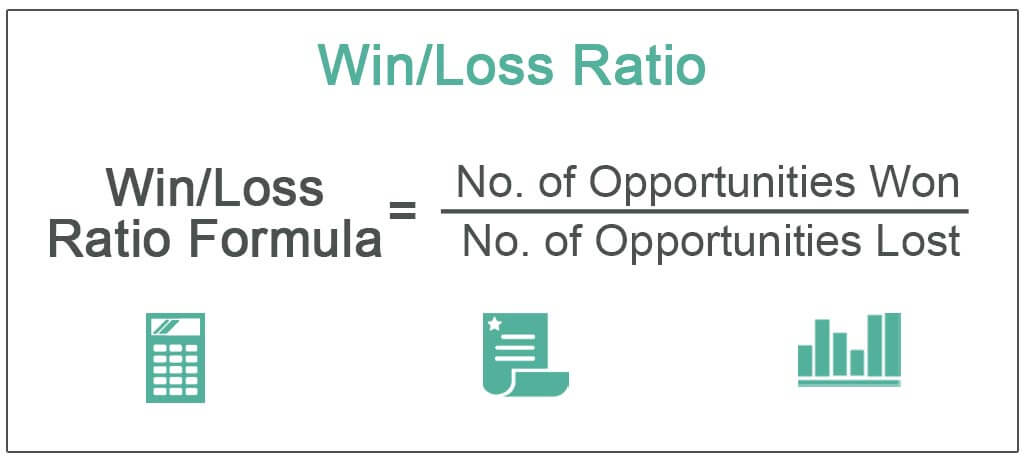
Win/Loss Ratio = No. of Opportunities Won / No. of Opportunities Lost.